In today’s manufacturing and IoT environments, machine monitoring is crucial for efficiency and predictive maintenance. By combining Node-RED for data collection and Grafana for visualization, you can build a powerful real-time monitoring solution.
In this guide, you’ll learn how to monitor machines with Node-RED and Grafana step by step.
Why Use Node-RED and Grafana Together?
- Node-RED: A flow-based tool that connects IoT devices, collects machine data, and processes it in real time.
- Grafana: A visualization platform that turns this data into interactive dashboards and alerts.
Together, they create a complete IoT monitoring system for factories, energy plants, and industrial machines.
👉 If you’re new to Node-RED, check out our Beginner’s Guide to Node-RED.
Step 1: Install Node-RED
Download Node-RED from the official Node-RED website.
- Install Node.js first
- Run
npm install -g --unsafe-perm node-red - Start Node-RED using:
node-red
By default, it runs on http://localhost:1880.
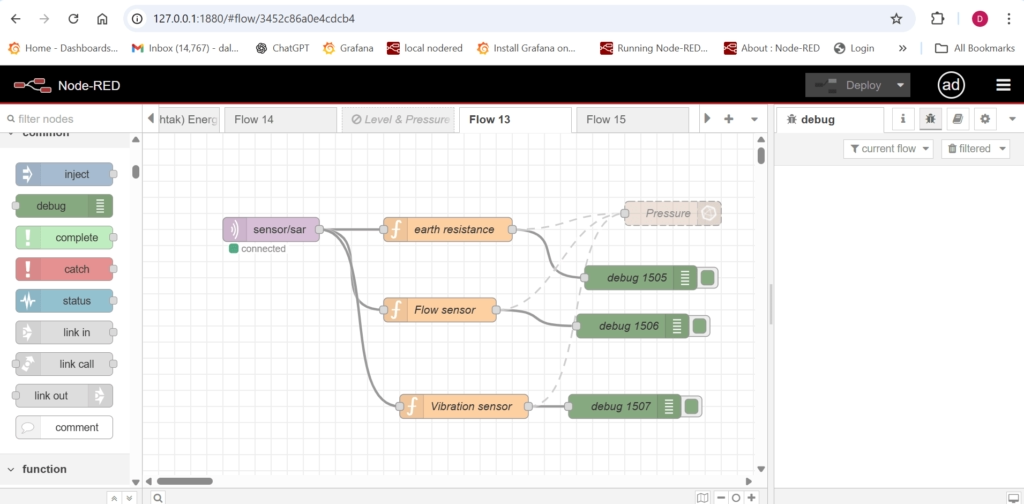
Step 2: Connect Machine Data in Node-RED
Machine data can come from:
- PLCs (via Modbus/TCP)
- Sensors (temperature, vibration, current, voltage)
- MQTT brokers
In Node-RED, you can drag and drop nodes:
- Input Nodes → Collect machine signals (MQTT, Modbus)
- Function Nodes → Process/clean the data
- Output Nodes → Send to a database (e.g., InfluxDB)
Step 3: Store Data in InfluxDB
InfluxDB is the most common choice for storing time-series machine data.
- Install InfluxDB
- Create a database for machine monitoring
- Configure Node-RED to send data into InfluxDB
Step 4: Visualize in Grafana
Once the data is stored, connect Grafana:
- Go to Configuration → Data Sources in Grafana
- Add InfluxDB as data source
- Create a new dashboard and add panels
- Select queries for machine metrics (temperature, run hours, downtime, etc.)
👉 Check our detailed guide on IoT Grafana Dashboards for setup tips.
Step 5: Setup Alerts
Grafana lets you configure alerts for machine health:
- High temperature
- Excessive vibration
- Unexpected shutdowns
Alerts can be sent via email, Slack, or Telegram for instant action.
Benefits of Monitoring Machines with Node-RED & Grafana
- Prevent downtime with early warnings
- Optimize performance by analyzing trends
- Save energy by detecting inefficiencies
- Increase productivity with real-time visibility
FAQs
Q1: Can I connect multiple machines in one dashboard?
Yes, Node-RED can collect data from multiple sources and Grafana can display them together.
Q2: Do I need coding skills for Node-RED?
Not much. Node-RED uses a visual drag-and-drop interface.
Q3: Which industries use this setup?
Manufacturing, automotive, energy, and smart factories widely use Node-RED + Grafana for IoT monitoring.
✅ Conclusion
By combining Node-RED for machine data processing and Grafana for visualization, you can build a real-time monitoring solution that improves productivity and reduces downtime.
👉 Start with Beginner’s Guide to Node-RED and then explore IoT Grafana Dashboards to create powerful machine monitoring systems.

