When people hear the term Artificial Intelligence or Machine Learning, they often imagine something extremely complex — robots, neural networks, or self-driving cars.
But the truth is, most real-world predictions still start with Linear Regression.
From:
- predicting electricity consumption
- estimating house prices
- understanding machine health
- forecasting production output
Linear regression quietly powers decisions behind the scenes.
I’ve worked with industrial data, vibration sensors, and real-time monitoring systems, and trust me — linear regression is still one of the most useful tools when used correctly.
In this article, I’ll explain:
- What linear regression really is
- How it works (without heavy math)
- Real-life examples
- Python implementation
- Industrial use cases
- Common mistakes
- FAQs
This post is written for humans, not machines.
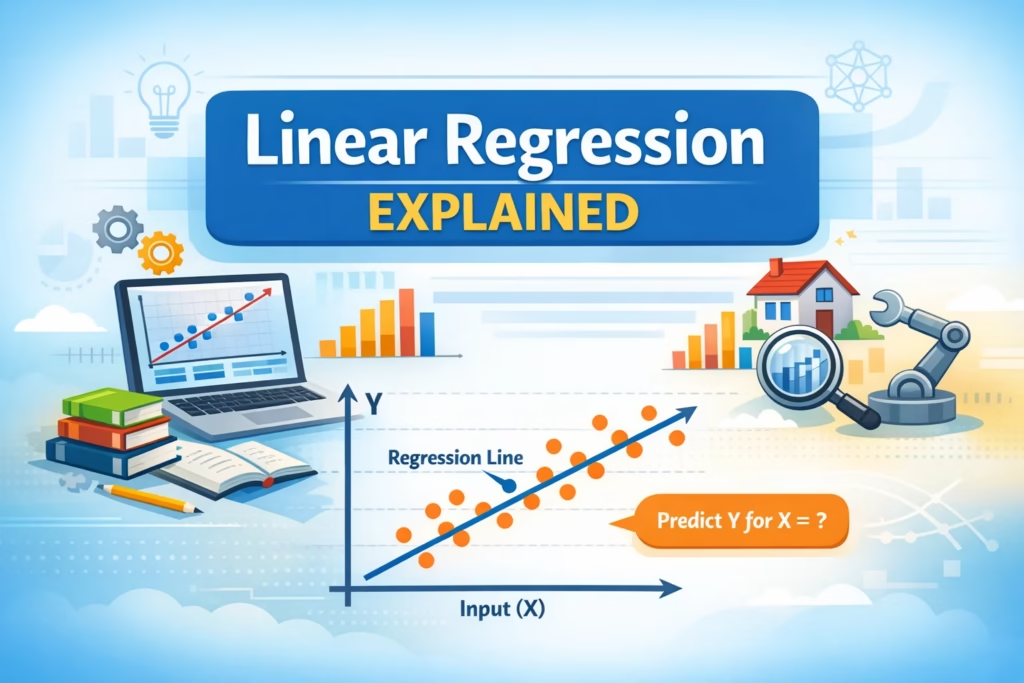
What Is Linear Regression?
Linear Regression is a statistical and machine learning method used to understand the relationship between:
- Independent variable (X) → input
- Dependent variable (Y) → output
It tries to draw the best possible straight line that fits the data.
Simple Definition:
Linear Regression finds the relationship between input and output using a straight line.
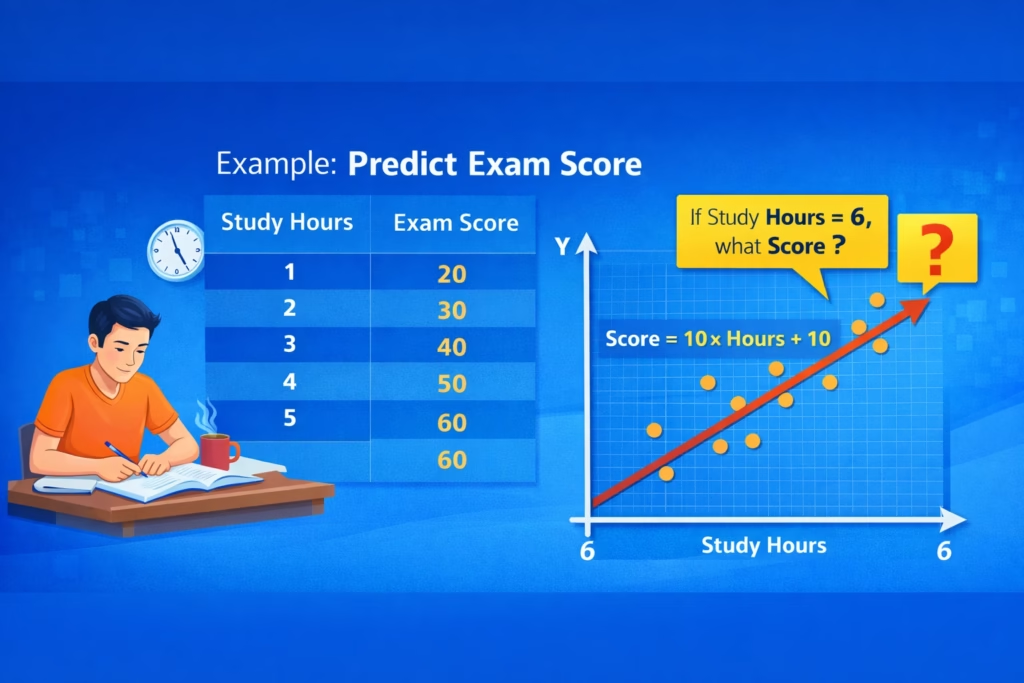
Simple Example (Real Life)
Imagine you track your daily study hours and exam scores.
| Study Hours | Score |
|---|---|
| 1 | 30 |
| 2 | 40 |
| 3 | 50 |
| 4 | 60 |
| 5 | 70 |
You can clearly see a pattern:
More study = higher score
Linear regression finds this relationship mathematically and helps answer:
👉 What score will I get if I study 6 hours?
Linear Regression Formula (Simplified)
The basic equation:
y = mx + c
Where:
- y = predicted output
- x = input value
- m = slope (how fast output changes)
- c = intercept (starting value)
Example:
Score = 8 × Study_Hours + 22
So for 6 hours:
Score = 8 × 6 + 22 = 70
Why Linear Regression Works So Well
Linear regression works because:
- Most real-world changes are gradual
- Data often follows linear trends
- Noise averages out over time
It is:
- Easy to understand
- Fast to compute
- Reliable for many engineering problems
That’s why it’s still used in:
- Manufacturing
- Finance
- Energy monitoring
- Predictive maintenance
Industrial Example: Motor Vibration Analysis
Let’s say you monitor a motor using vibration sensors.
Sample Data:
| Load (Amp) | Vibration (mm/s) |
|---|---|
| 2.0 | 1.2 |
| 2.5 | 1.6 |
| 3.0 | 2.1 |
| 3.5 | 2.7 |
| 4.0 | 3.4 |
You want to predict vibration when load increases.
Linear regression finds:
Vibration = 0.8 × Load – 0.3
This helps you:
- Detect abnormal vibration
- Predict faults early
- Schedule maintenance
Example 1 – Linear Regression Line
(Example: Dots = data points, Line = prediction model)
Types of Linear Regression
1️⃣ Simple Linear Regression
Uses one input variable.
Example:
Temperature → Power Consumption
2️⃣ Multiple Linear Regression
Uses multiple inputs.
Example:
Power = a × Load + b × Temperature + c × Speed + d
Used heavily in:
- Industrial automation
- Energy analytics
- Manufacturing dashboards
Python Example (Very Simple)
import numpy as np
from sklearn.linear_model import LinearRegression

# Input data
X = np.array([[1], [2], [3], [4], [5]])
y = np.array([30, 40, 50, 60, 70])

# Model
model = LinearRegression()
model.fit(X, y)

# Prediction
prediction = model.predict([[6]])
print("Predicted score:", prediction[0])
✅ Output:
Predicted score: 78
Real Industrial Example (Machine Health)
Imagine you collect data from a vibration sensor:
| Load | RMS Vibration |
|---|---|
| 20% | 1.1 |
| 40% | 1.8 |
| 60% | 2.6 |
| 80% | 3.3 |
You train a linear model.
Now:
- If vibration suddenly jumps to 5.0
- You know something is wrong
This helps in:
- Predictive maintenance
- Fault classification
- Preventing breakdowns
Linear Regression in AI Systems
Linear regression is often the first step before advanced AI models.
Used for:
- Feature engineering
- Baseline prediction
- Trend detection
- Anomaly scoring
Even neural networks learn patterns similar to linear regression in early layers.
⚠️ Common Mistakes to Avoid
❌ Using linear regression for non-linear problems
👉 Example: Temperature vs efficiency curves
❌ Ignoring outliers
Bad data = bad predictions
❌ Using too little data
Always collect enough samples
❌ Ignoring domain knowledge
Data science without domain logic fails
📈 How to Improve Accuracy
✔ Normalize your data
✔ Remove noise
✔ Use rolling averages
✔ Combine with domain thresholds
✔ Validate using historical data
Example 2 – Prediction Trend
Real-World Use Cases
🏭 Manufacturing
- Machine health monitoring
- Energy optimization
- Downtime prediction
⚡ Energy Sector
- Power load forecasting
- Solar generation estimation
🏠 Real Estate
- Price estimation
- Area-based valuation
🏥 Healthcare
- Patient health trend analysis
When NOT to Use Linear Regression
Avoid when:
- Relationship is highly nonlinear
- Data is categorical without encoding
- Strong outliers exist
In such cases, use:
- Decision Trees
- Random Forest
- Neural Networks
Frequently Asked Questions (FAQ)
❓ Is linear regression still relevant in 2025?
Yes. It is still widely used in engineering, finance, and AI pipelines.
❓ Is linear regression machine learning?
Yes, it’s a supervised learning algorithm.
❓ Can I use linear regression for prediction?
Absolutely — that’s its main purpose.
❓ Does linear regression work for sensors?
Yes. Especially for vibration, temperature, current, and pressure data.
❓ Can I combine it with AI models?
Yes. It’s often used as a baseline or feature extractor.
🧠 Final Thoughts
Linear regression may look simple, but it is one of the most powerful tools in data science.
Whether you’re:
- Building dashboards
- Predicting failures
- Optimizing performance
- Learning AI
This model will always remain relevant.
Start simple. Understand deeply. Then scale.
Final Words
If you’re working with:
- IoT sensors
- Industrial automation
- Predictive maintenance
- AI-based analytics
Linear regression should be your first step.